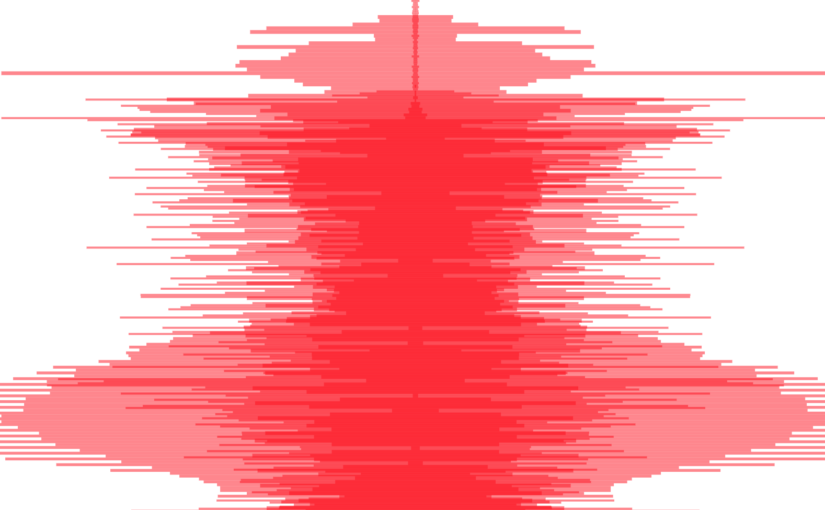
I created a digital self portrait in the form of a ‘waveform mashup’.

The waveform mashup is a visual abstraction of waveform data from my ‘Top Songs of 2017’ as defined by Spotify.
The visualization above was created based on high-density waveform data. For the web I created one with less dense data which you can view in your browser here. Code repository can be found here.
DETAILS:
This project visualizes waveforms vertically as opposed to horizontally, so that the left and right sides of the waveform are aligned to the viewers ears, as opposed to using left ➡️ right as an axis to emphasize chronology.
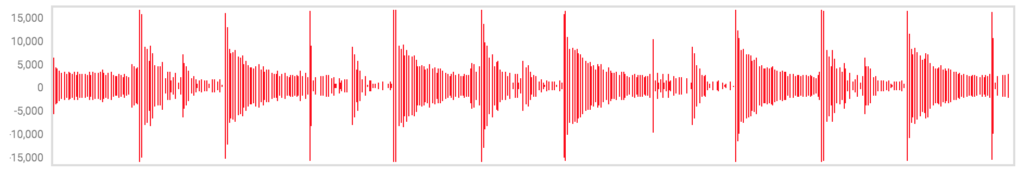
The vertical waveforms of many songs are given a weak opacity and layered on top of each other in order to create the ‘mashup’ itself. For example, here is a mashup of only 3 songs, with a slightly stronger opacity:
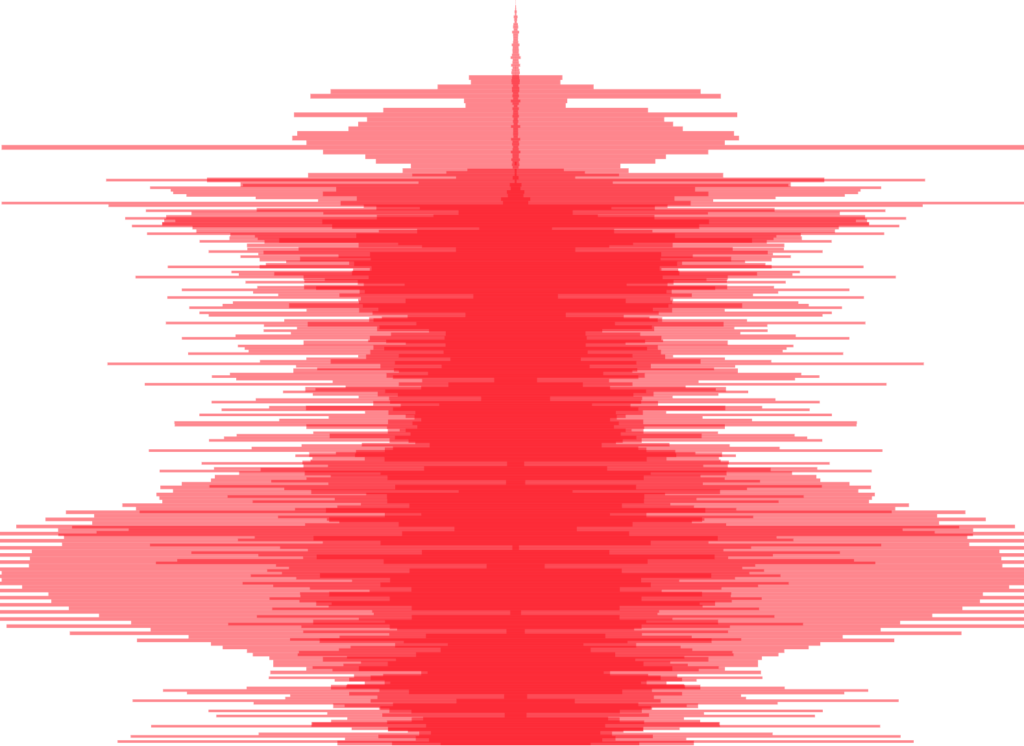
As more songs are added, the visualization becomes more abstract. The goal of this project overall is to re-convert this mashup into audio for an aural self-portrait.
DATA PROCESS:
Processing was one of the most fun parts of this project for me. I used a variety of tools to convert the songs in my Spotify into the data used above.
Getting the MP3 Data
Starting with data created by Spotify based on my account usage:
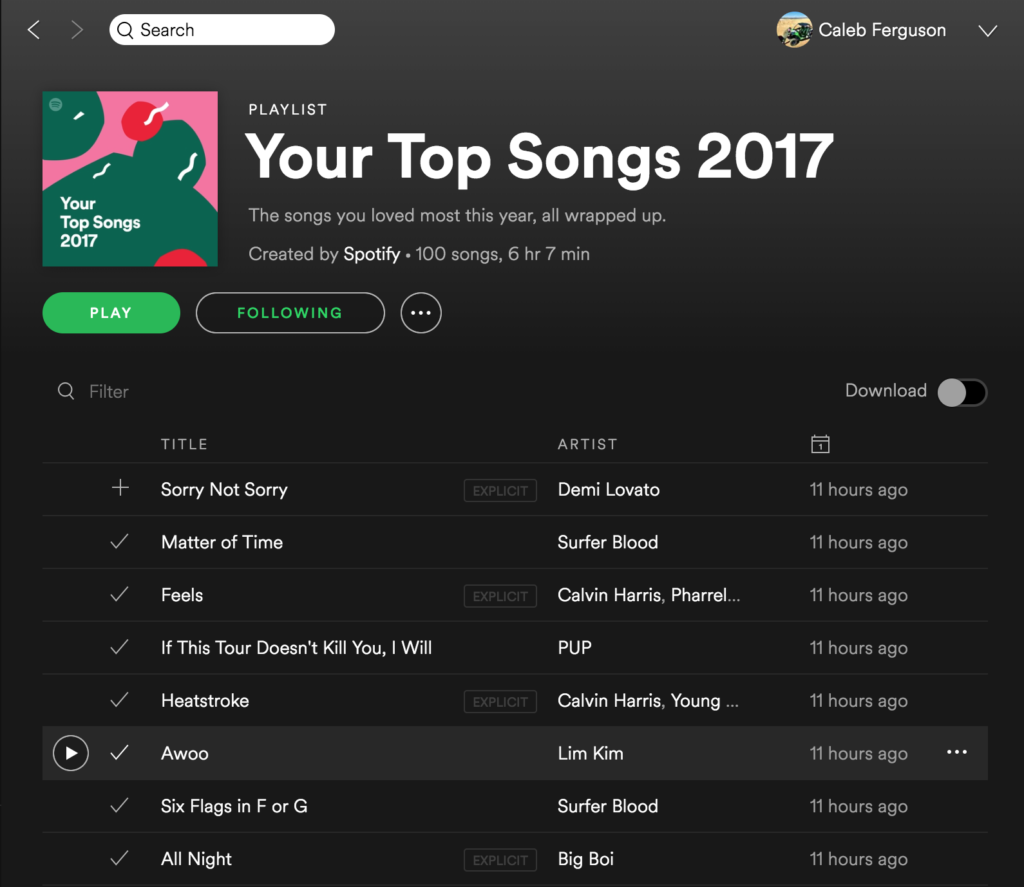
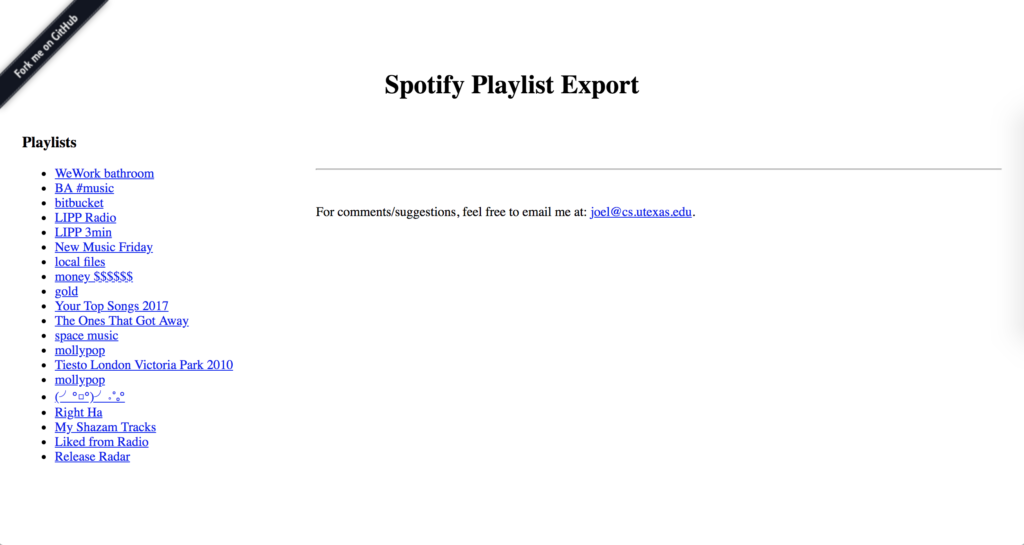
I first used a simple online tool by Joel Lehman called ‘Simple Playlist Exporter‘ that converts the playlist information into CSV format
I then used my dear old friend Microsoft Excel to do quick analysis of the data and add other information to the list. I added:
- A song ID (001 – 100) for data management purposes
- Genre (self-defined) which broke into 3 categories (Hip-Hop/Rap, Pop/Electronic, and Punk/Rock)
- Youtube links to each song – a time-intensive manual process 💤
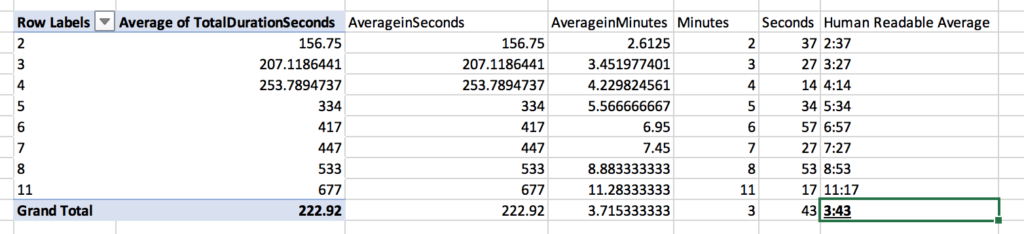
- and finally the duration of each song – a boring manual process recorded and sped up to 400% for your viewing pleasure:
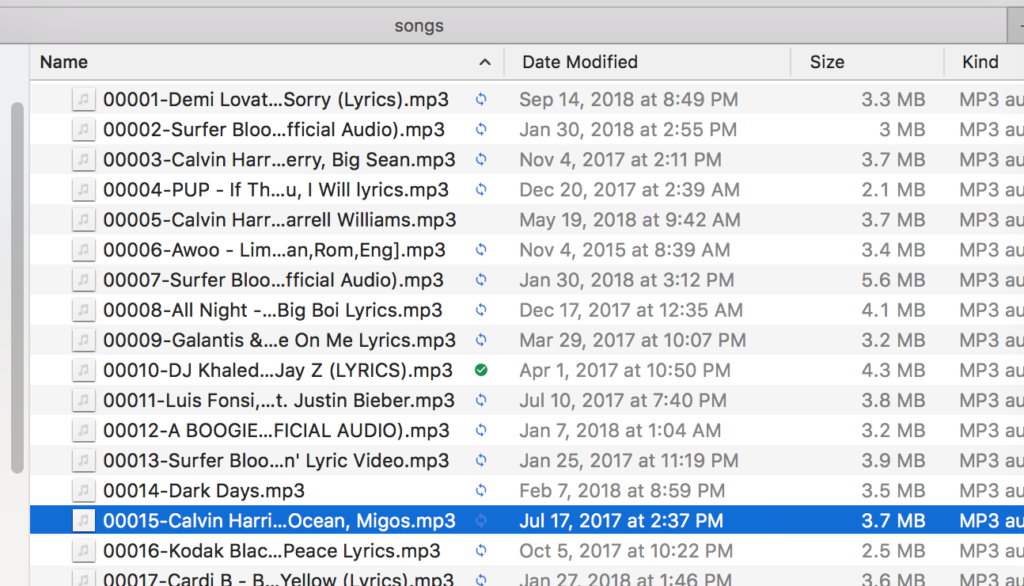
I used the wonderful youtube-dl tool to batch download the mp3 file of each song and assign them a numeric label. The command looks like this:
youtube-dl -x --audio-format 'mp3' -o "%(autonumber)s-%(title)s.%(ext)s" --batch-file='youtube-link-list.txt'
This moment was magical for me, as the mp3 filed into a folder one after the other:
Some quick summary statistics from the data set:
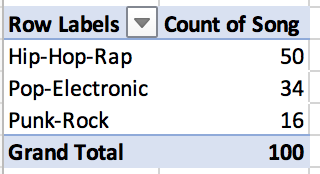
Pivot tables are your friend, people:
Getting the waveform data
I created my visualization using D3, based on the John Magoonian III’s D3 waveform visualizer – thank you John.
This D3 script uses JSON data that has this format as an input:
{"sample_rate":48000,
"samples_per_pixel":256,
"bits":16,
"length":38228,
"data":[-1,0,-1,1,-3,1,-6,5,-9,8,-15,13,-156,266,-333,359,-361,363,-332,328,-293,294,-258,276,-223,259,-182,263,-171,263...]
}
The key element of this JSON is the “data” field, which contains the left and right waveforms as negative and positive numbers, respectively.
To get data in this format for my MP3s, I used BBC’s audiowaveform tool. It converts audio files (MP3, WAV, etc) into .DAT files:
audiowaveform -i song.mp3 -o song.dat
which then can also be converted into JSON files:
audiowaveform -i song.dat -o song.json
I created a shell script to run these commands on all of the MP3s in my folder. I also had to cleanse the data by removing space and comma characters from the file names. For those like me that are just starting with shell scripting, you can find what I used here.
I also learned the tool can convert directly from .mp3 to .json – no need to make .dat files. The command instead looks like this:
audiowaveform -i song.dat -o song.json
RENDERING:
A red-flag I did not notice at this point was that each JSON file was about 500kB in size – making the total file size for 100 songs around 50MB – this created issues once I had successfully linked my JSON data to the D3 script.
In order to make a visualization that can be replicated elsewhere, I needed to cut down on the file size by re-doing the data processing with a smaller sample rate.
So, returning to the JSON file creation, I played with both the bitrate and sample rate:
- Changing the bitrate from 16 to 8 certainly reduced the file sizes, but also severely decreased the difference in horizontal wave “lengths”, making the visualization way more “blobby”. Ultimately I left the bitrate at 16
- Changing the sample rate, I found higher numbers for the sample rate decreased the file size. Moving from the default of 256 upwards, I landed on a sample rate of 1,048,576 – 4,096 times smaller than the default, resulting in files sizes of ~2 KB each – 422 KB in total
adding these options, the audiowaveform command looks like this:
audiowaveform -i song.mp3 -o song.json -z 1048576 -b 16
Even given this total decimation of file size, D3 still takes a few seconds to render. My current suspicion is that it is re-drawing the entire canvas every time it loops to the next JSON file instead of adding a single SVG element to the DOM.
Next steps include:
- Modify D3 code to render faster/more efficiently
- Use jQuery to create a “standby” style message until after the data loads. Given that d3 loads asynchronously, it’s unfortunately not as simple as sticking in a
$.when(d3activity).done
- Use jQuery to show the waveform being built, adding 1 layer (or even one waveform data bar) in a digestible, appealing way
- Link user activity in the Spotify iFrame to the data – for example, if a user clicks play on a song, highlight that waveform in the portrait
Note: the music data downloaded for this project was for artistic purposes and is not played without proper authorization in the final piece. Please don’t sue me, I’m making art here.
2 replies on “Waveform Mashup – A Self Portrait with Data”
[…] is the second assignment of late that has asked for a self-portrait of some […]
[…] availability, and use. The challenges of wrangling my information, which I outline in detail here, involved many manual steps […]