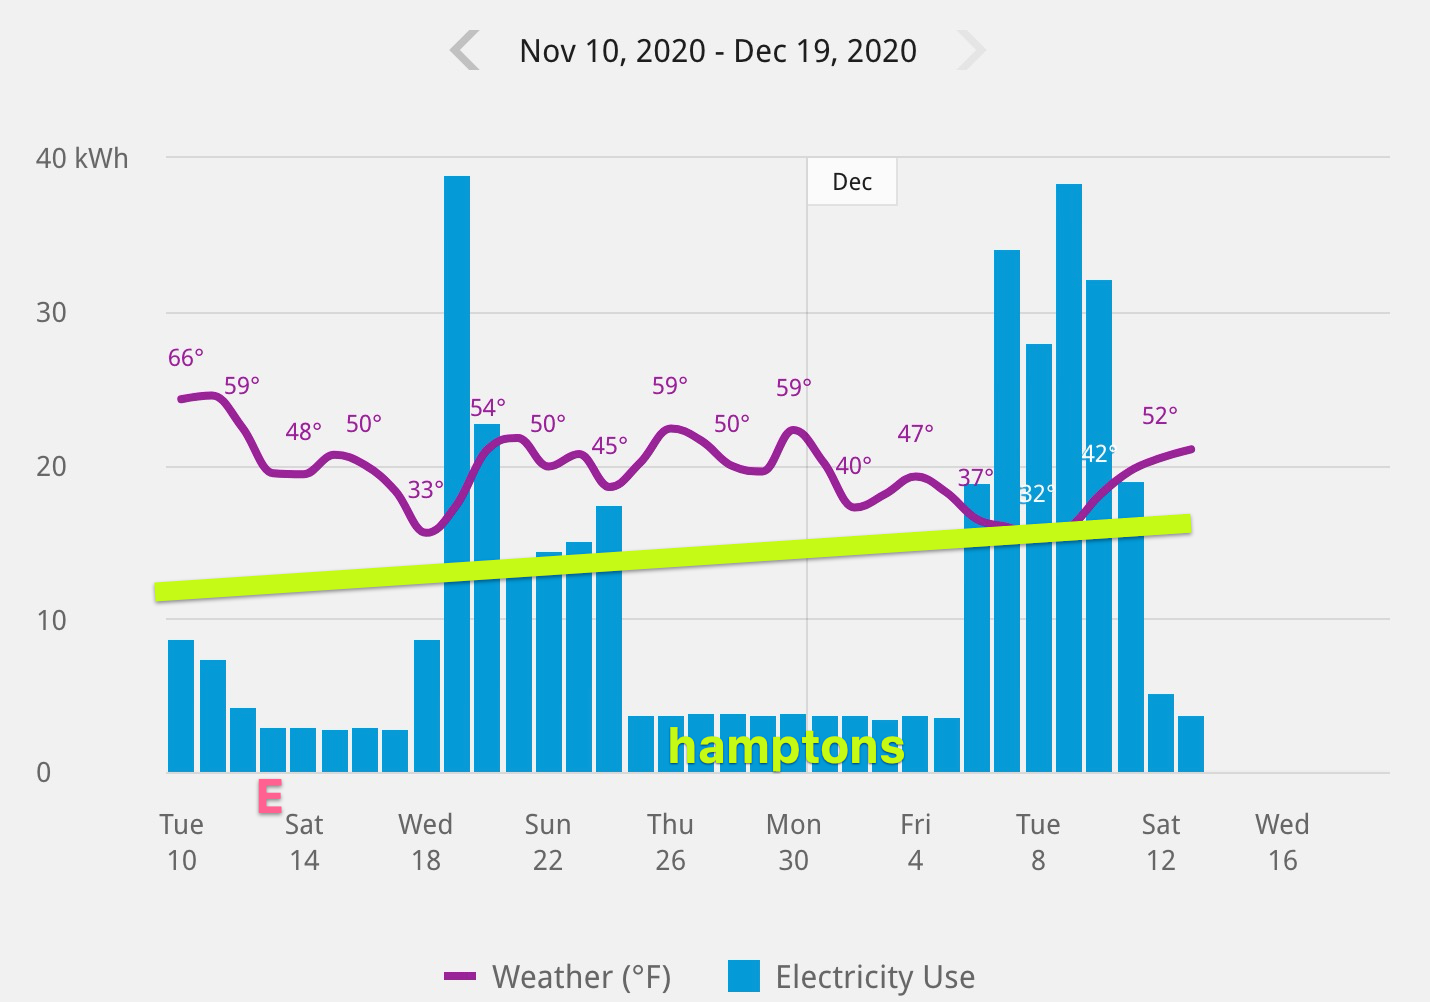
Blasted the heaters all day on Tuesday. Was awesome.
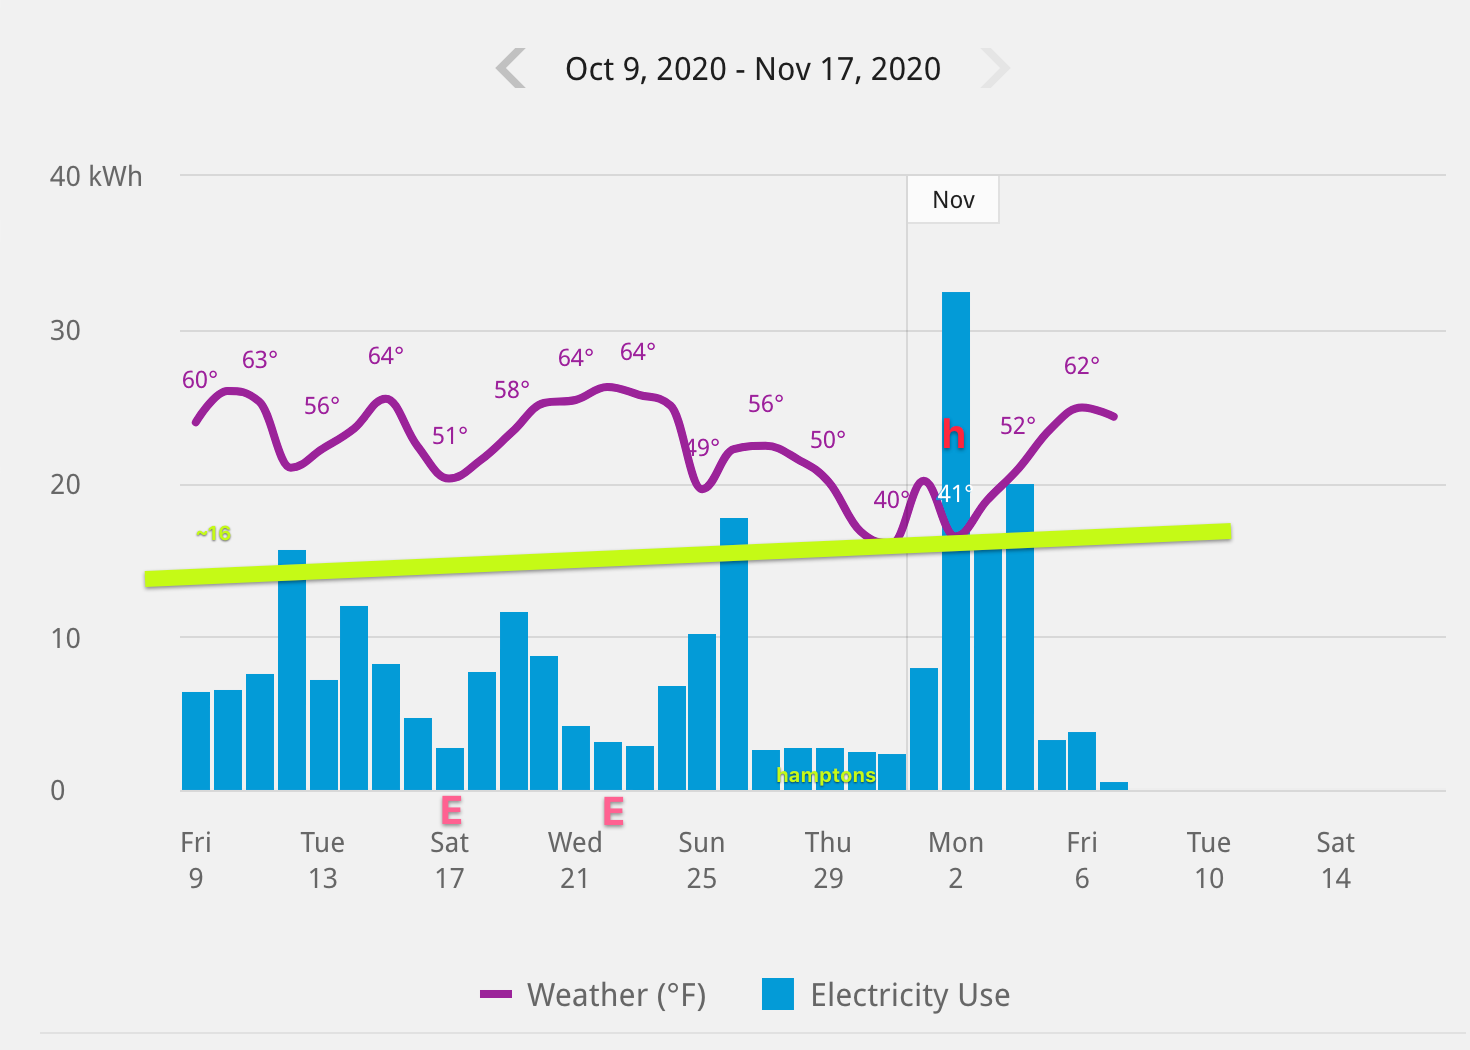
November - December 2020
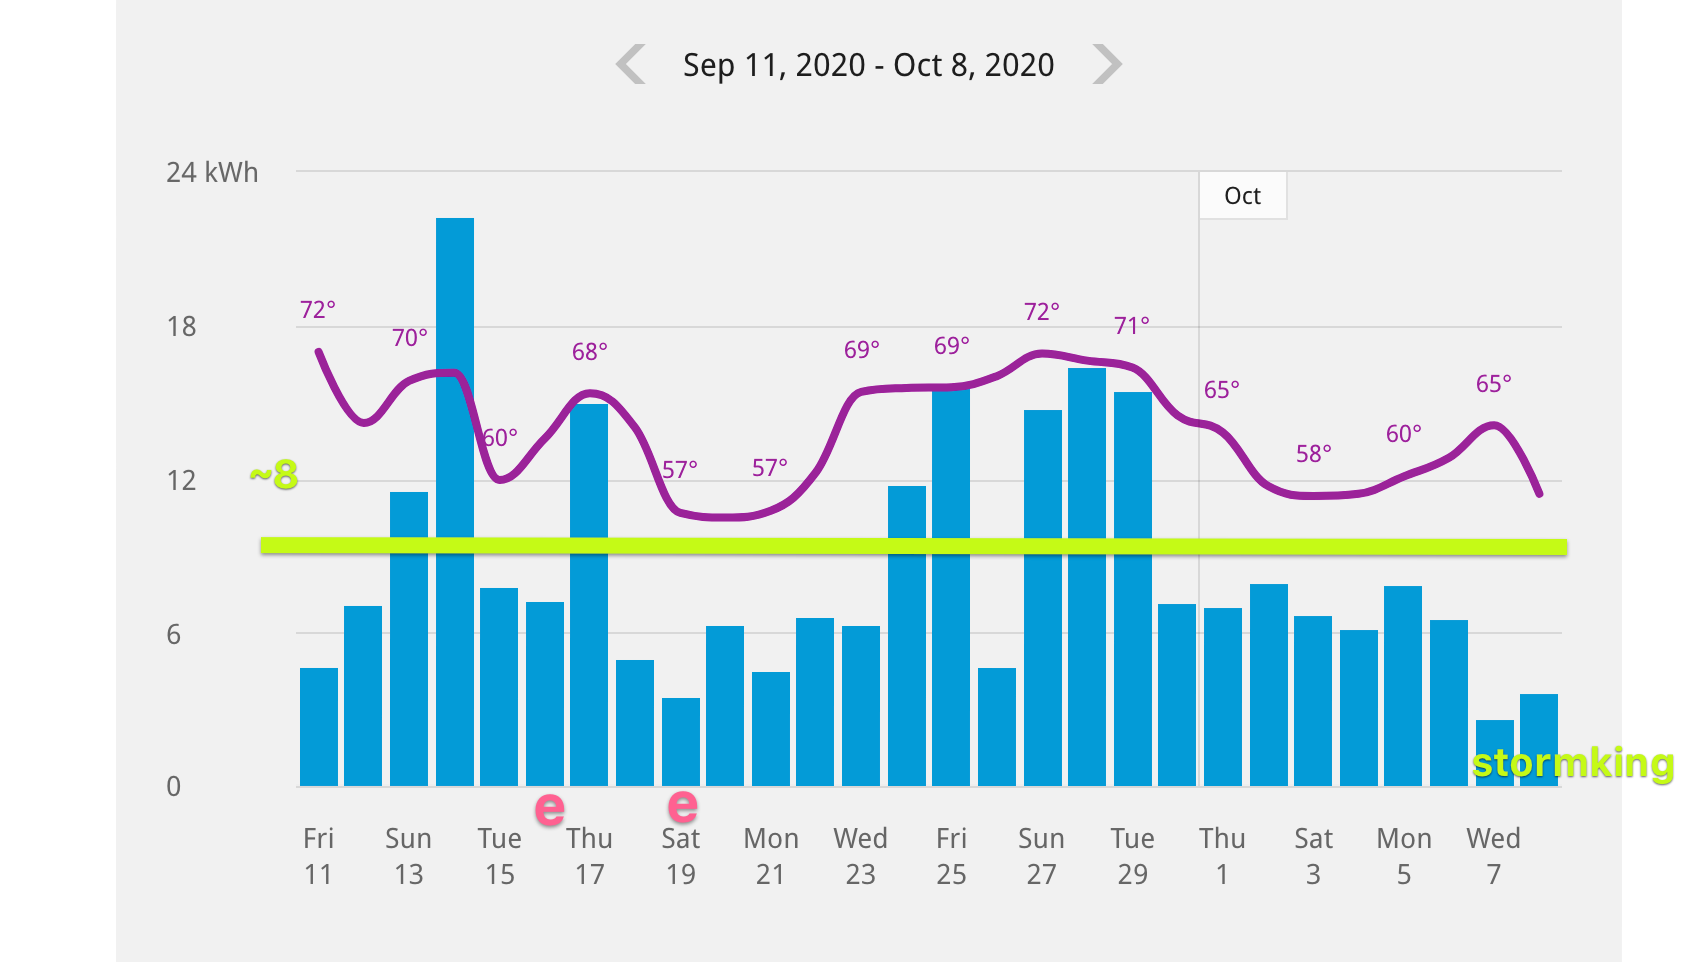
Average usage pushing way up on the days that I’m home. Luckily spent some time **elsewhere** this past month
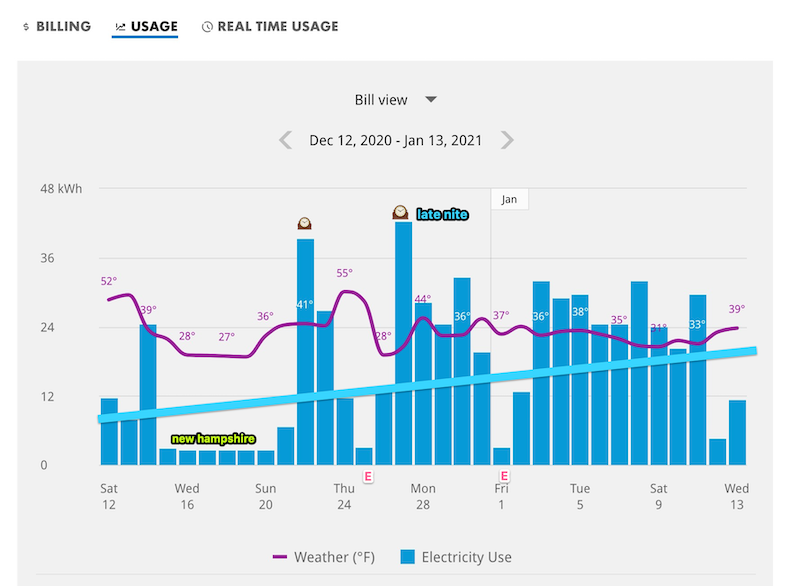
December 2020 - January 2021 🎆
Its been getting COLDER and I keep the heater going all. day. Most expensive bill yet. You can see average usage climbed and is consistently higher at around the ~24 kWh mark.
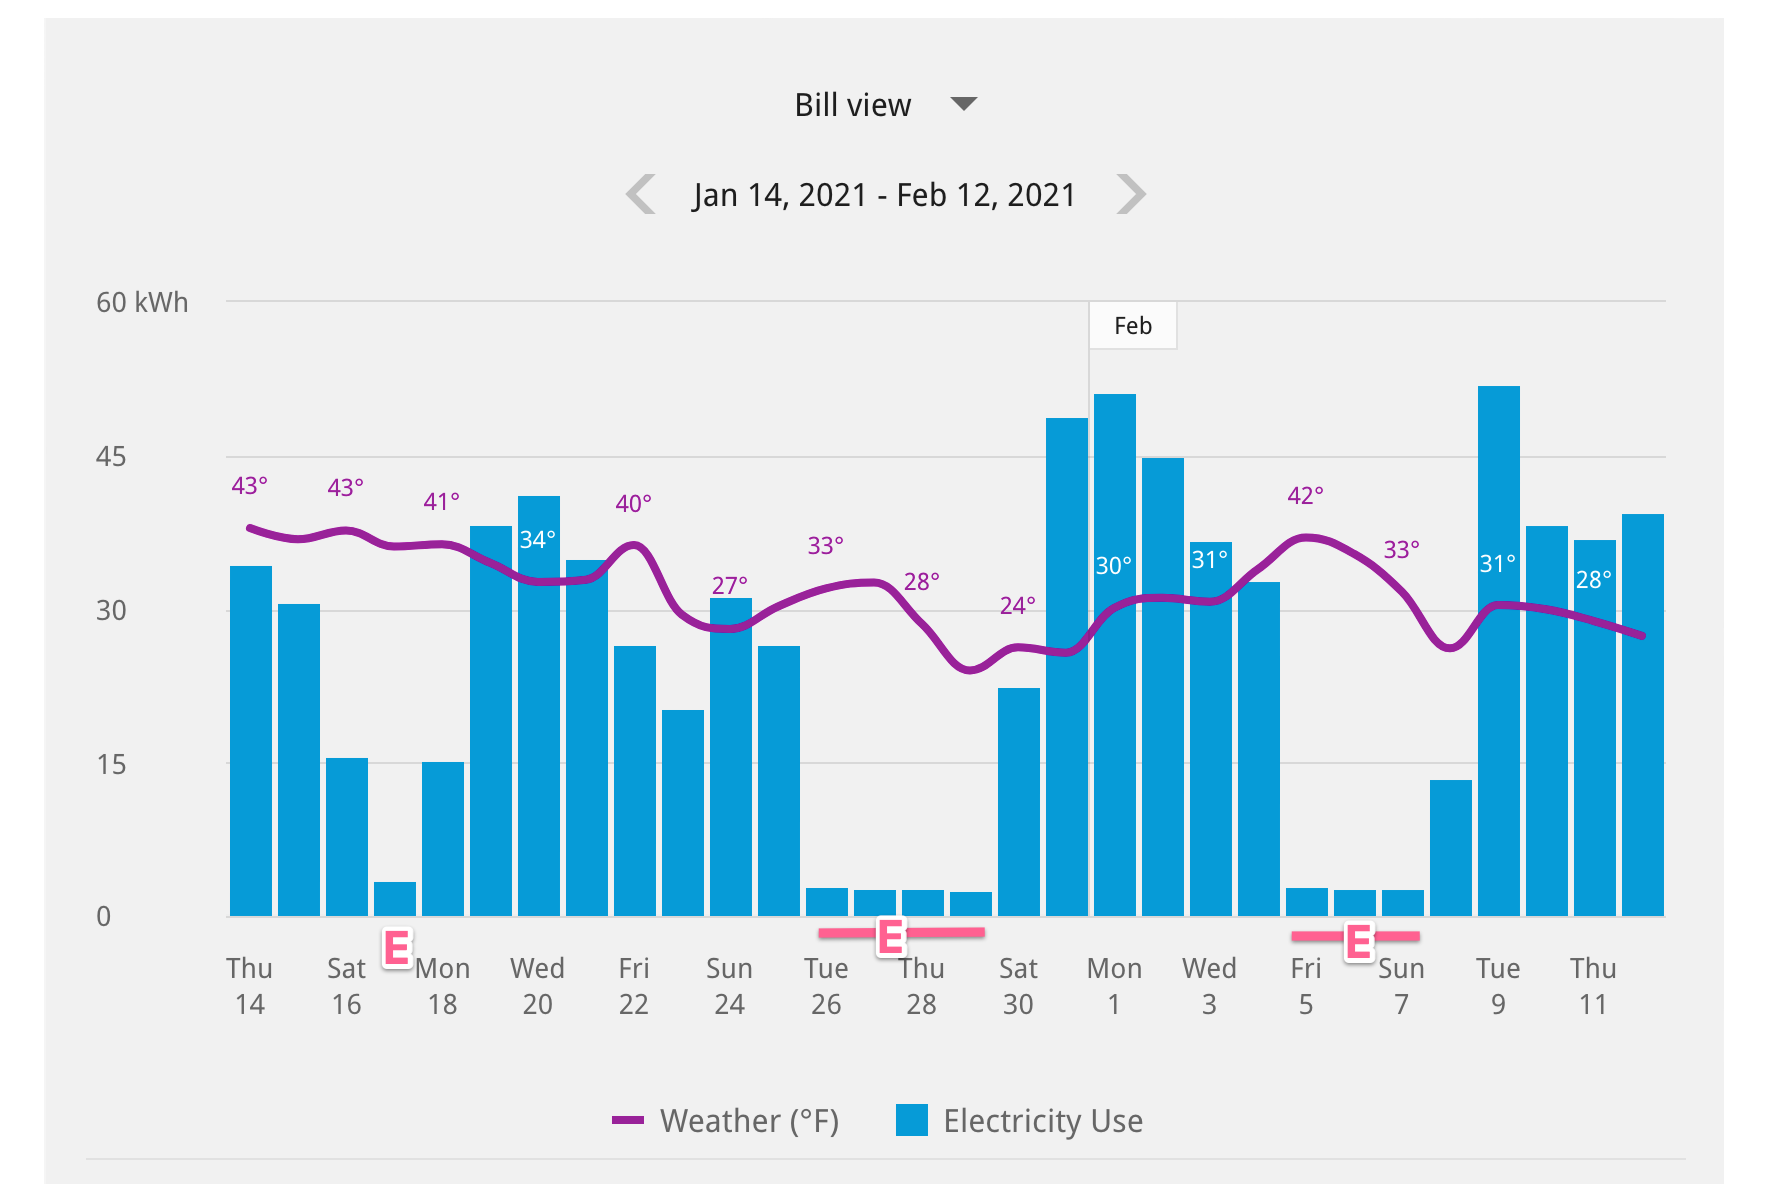
January - February 2021
February - March 2021 💘
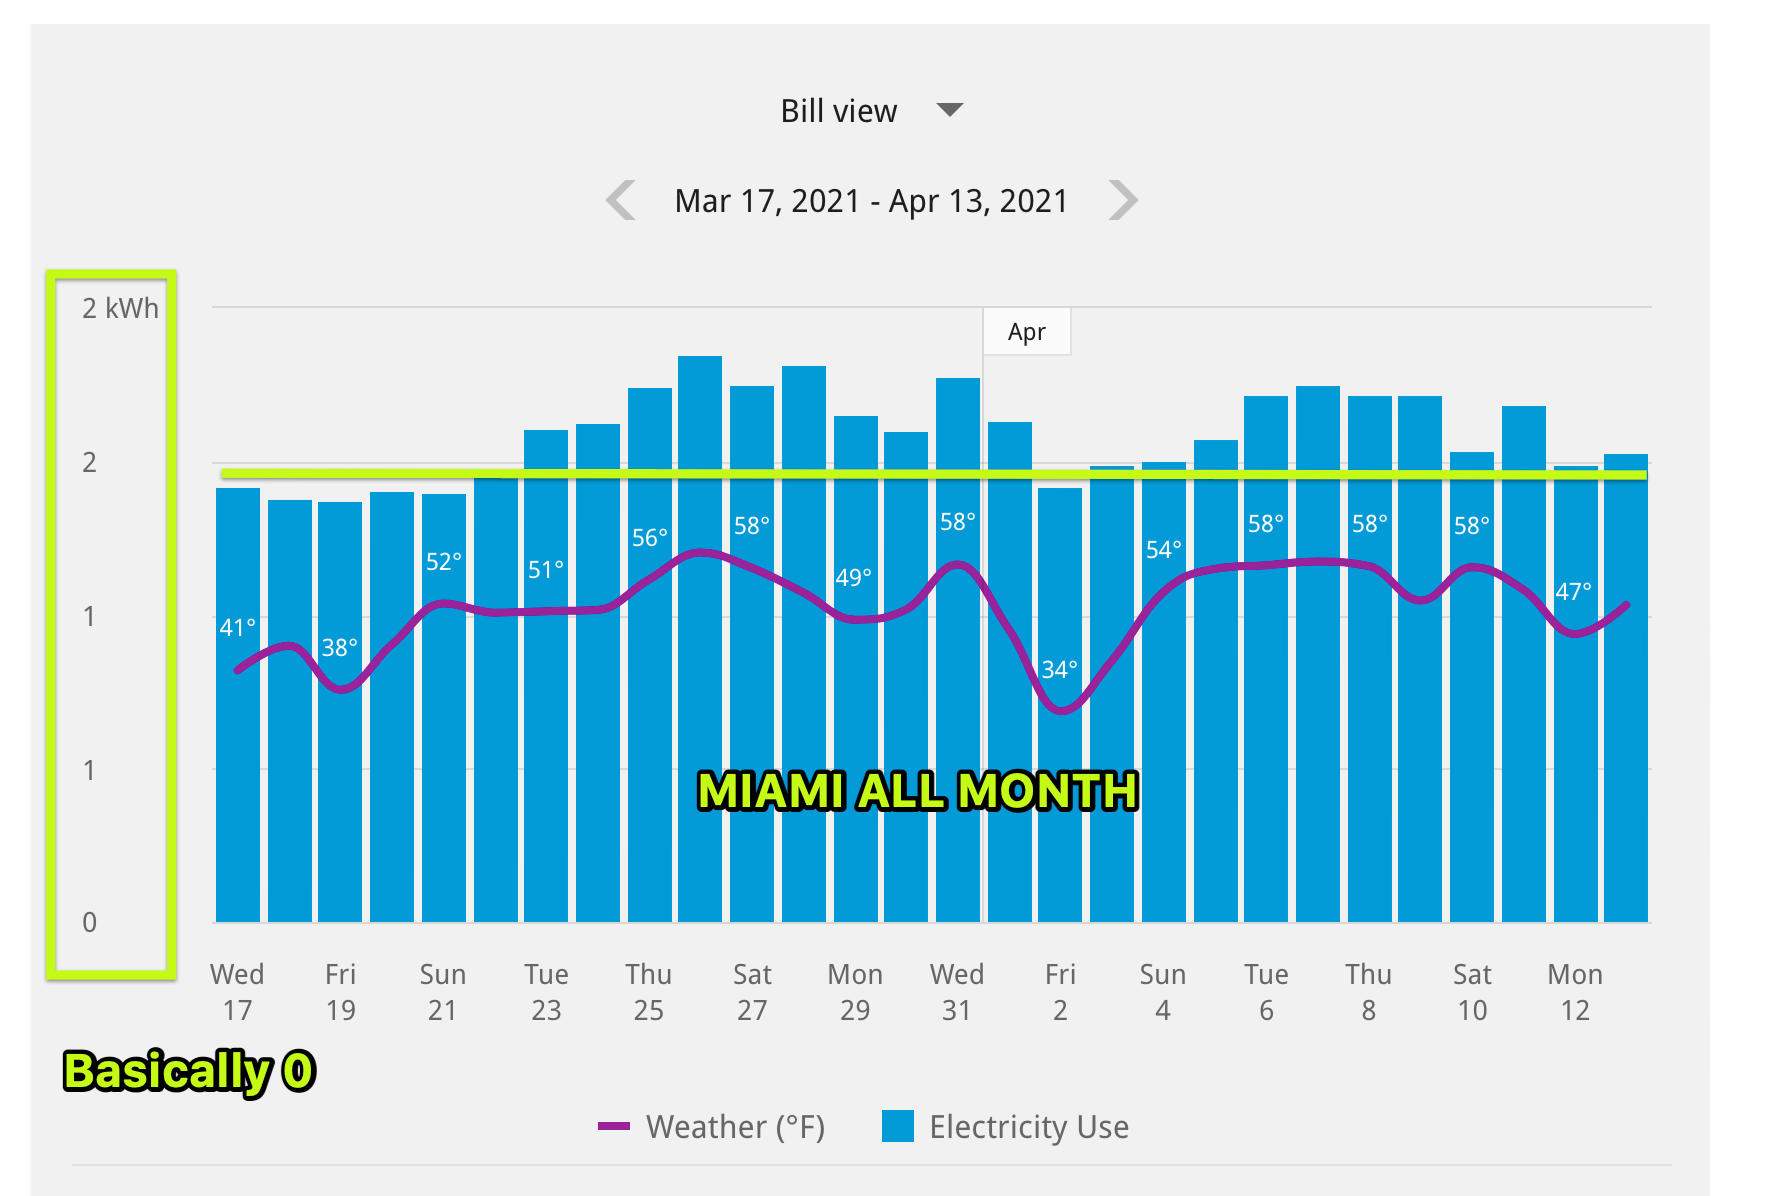
March - April 2021 🏝
I was in Miami, beach. No energy usage.
Despite unplugging everything in the apartment (fridge, router, etc), as you can see, there is still a baseline amount of consumption (~2 kWh)
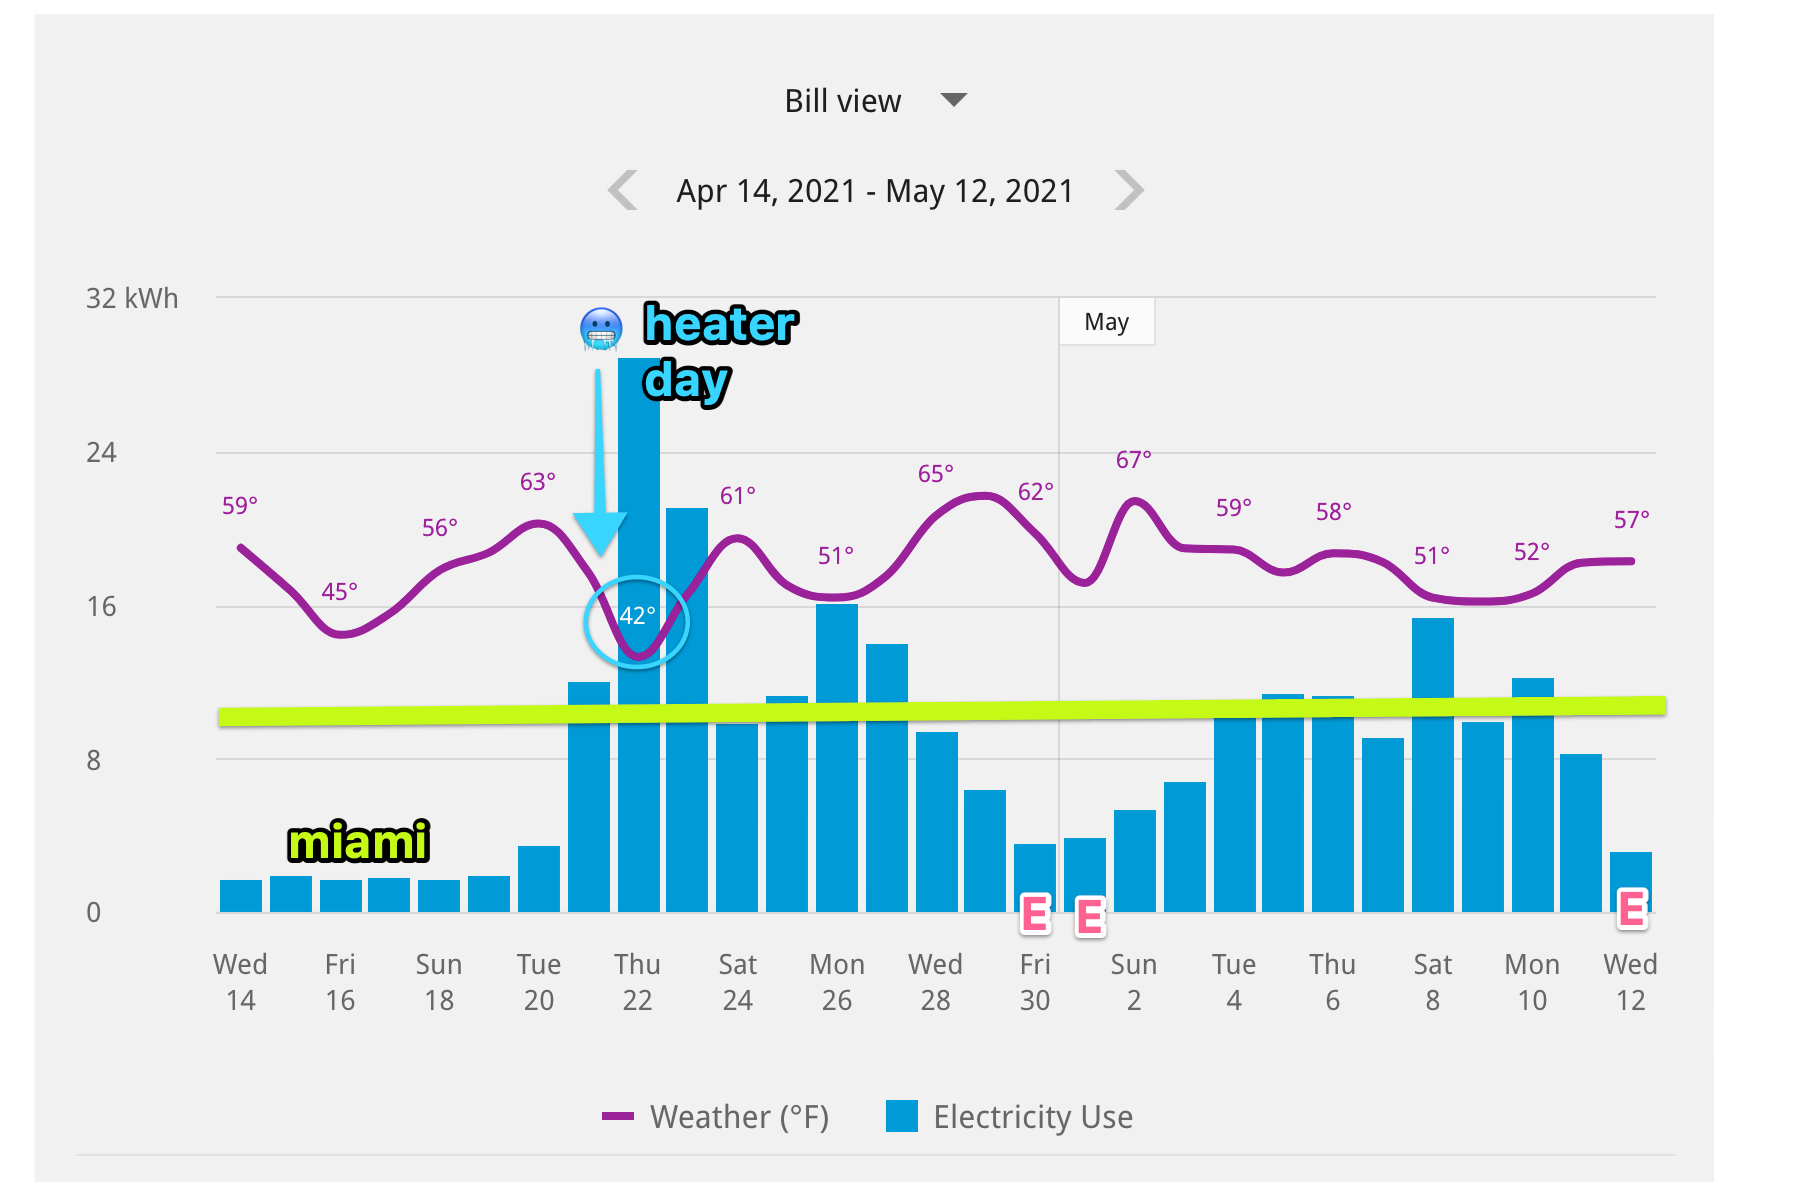
April - May 2021
You can really see the impact of the heater on consumption here
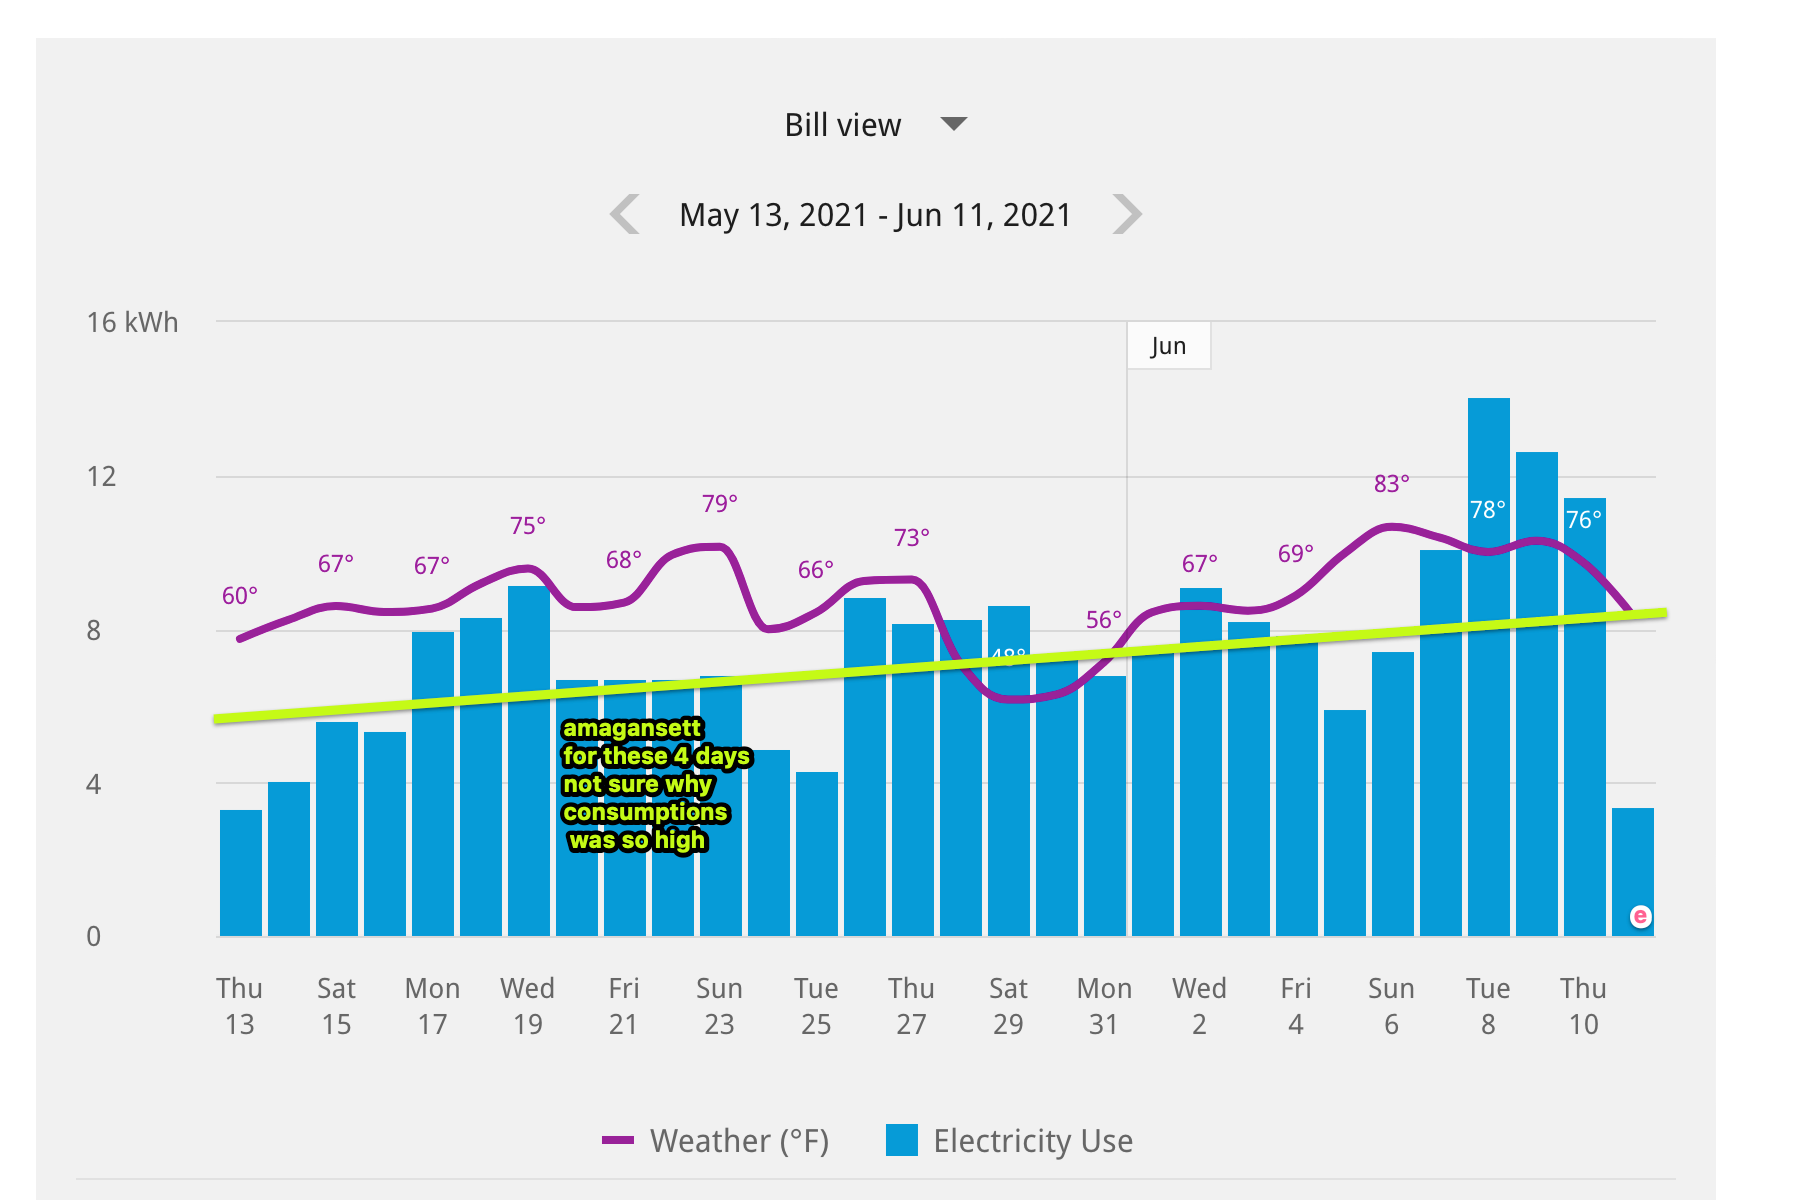
May - June 2021
A curious one – consumption was overall lower but seems like it was not impacted by my activity – when I was gone for 4 days, the apartment was still consuming ~7 kWh per day… I definitely remember saying “hey google, turn everything off” before I left, too.
June - July 2021
Lots of time away from the apartment helped keep this month from being a blowout in terms of consumption. On the days I was there, averaging 12+ kWh