Economics is regarded as a ‘soft science’ because it studies a field that is heavily influenced by human behavior.
Despite developing rigorous models the world depends on, precise measurements that move markets, and insights for how humans behave, economics is dependent on some key assumptions (such as rational actors).
For this reason, it is often a target of criticism from the ‘hard sciences’:

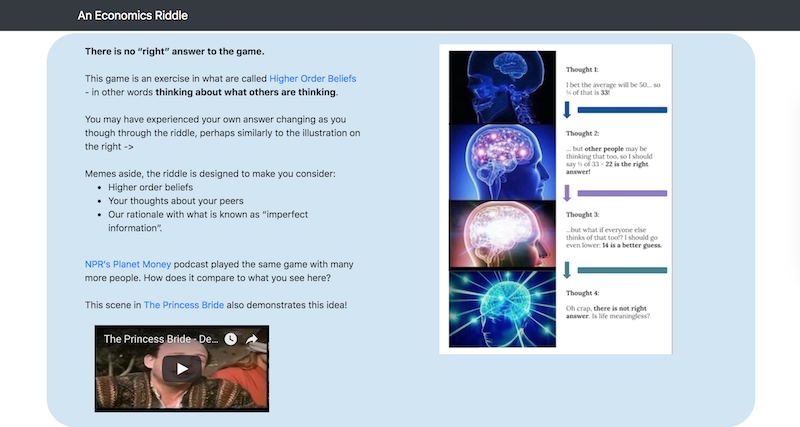
Economists even study how rational we can be with the information we have, a branch of game theory involving higher order beliefs.
I made a small web project < outdated – check out the ol’ repo here to demonstrate the concept of higher order beliefs. It uses memes to make it more fun. Please check it out and participate!
Why did you make this?
I hope people who visit this site develop and understanding of the delicate dance between math, logic, and perception that economics performs. I made this to give people a change to be in an economist’s shoes with a “live” example.
What does it do?
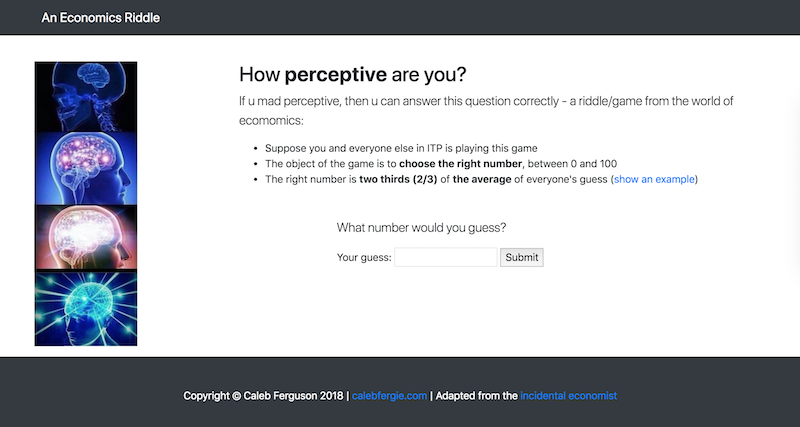
The website asks you to submit a number between 1 and 100. The goal is to choose a number that takes other people’s submissions into account – in other words, think about what others are thinking.
Once you submit a guess, your submission is logged to a database and the website performs some mathematical operations to supply a response such as this one:
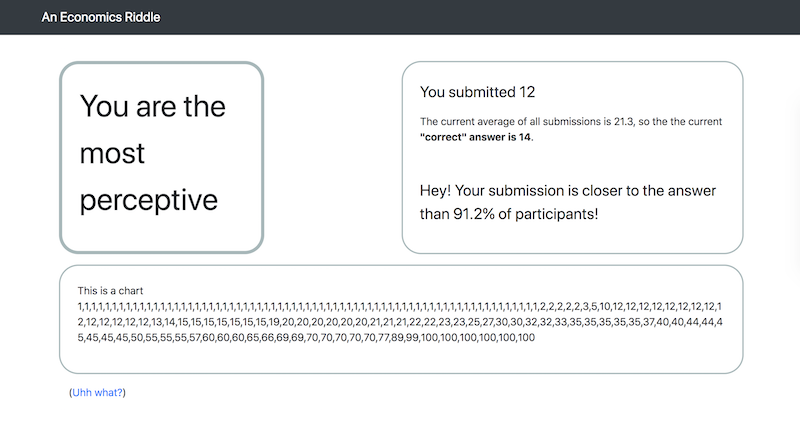
The response page also provides some additional information – a list of all the responses so far, space for a graph (‘This is a chart’) , and a link (the ‘Uhh what?’) that provides more context.
How does it work?
This website was created using an iterative approach – starting with a simple http server using node.js. The various iterations of the project can be found on GitHub here. Some of the key aspects of the current version are:
- An Express server (EJS views) to handle overall requests to the website
- An online database (mLab via mongojs) to store and serve guess information
- A Bootstraps template for visual style of the pages
- jquery & AJAX for interaction with the context buttons on both pages (‘show an example’ and ‘Uhh what?’)
- Cookies to track user information
Key code can be found in the main javascript file: results.js, which runs after the “Submit” button is clicked. The rest of this post describes some key aspects of this script.
(A) Linking to a database while also hiding the username and password information. The name of my database is “mr-worldwide”. Dale.
//Setup
 var db = mongojs(dbconfig.username + ":" + dbconfig.password + "@ds239128.mlab.com:39128/mr-worldwide", ["guessTable"]);
(B) Using cookies to determine what action to take.
//Check to see if the user has been here before with COOKIES YUM
 var visits = 1;
 if (request.cookies.visits) {visits = Number(request.cookies.visits) + 1;}

if (visits > 1) {repeatVisit = "yes";}
else {repeatVisit = "no"}

respond.cookie('visits', visits, {}); // Set the new or updated cookie

var userInfo = {repeatVisitor: repeatVisit};
if (userInfo.repeatVisitor === "yes") {....} else {...}
(D) Doing math – I wrote these myself. They may not be perfect.
Finding the average
var subTotal = 0;

for (i = 0; i < dataSet.length; i++) {
 subTotal = subTotal + dataSet[i];}

var average = (subTotal / dataSet.length);
Finding the median – thanks caseyjustus for the insight
//sort the list
dataSet.sort(function(a, b) {return a - b});

// find appropriate median based on response count (even vs. odd)
var half = Math.floor(dataSet.length / 2);

if (dataSet.length % 2 === 0) {var median = dataSet[half]}
else {median = (dataSet[half - 1] + dataSet[half]) / 2;}
Find the percentile using the median
///make a list of all submissions distance from the median
var tempData = []

for (i = 0; i < dataSet.length; i++) {
 var dist = Math.abs(dataSet[i] - median);
 tempData.push([dataSet[i], dist]);}

// determine which position the submitted value is in
var subPos = dataSet.indexOf(numberValue);

// create counters
var farther = 0; var equal = 0; var closer = 0;

// loop through the data to compare each distance
 for (i = 0; i < tempData.length; i++) {
   if (tempData[subPos][1] < tempData[i][1]) {
   farther = farther + 1;}

   else if (tempData[subPos][1] == tempData[i][1]) {
   equal = equal + 1;}

   else {closer = closer + 1;}
}

// determine the percentage of submissions farther from the median than the current one
var percentage = ((farther / dataSet.length) * 100);
Build a qualitative feedback threshold as well:
// Make a list of responses
var success = ["not at all", "not", "only kinda", "pretty", "super", "the most"];

// determine the threshold for each level of quality
var cutoff = 100 / success.length;
var tier = cutoff;

// determine which response fits the current submission
for (i = 0; i < success.length; i++) {
 if (tier < percentage) {tier = tier + cutoff;}
else {var level = success[i];
      break;};
 }